Data exploratory analysis
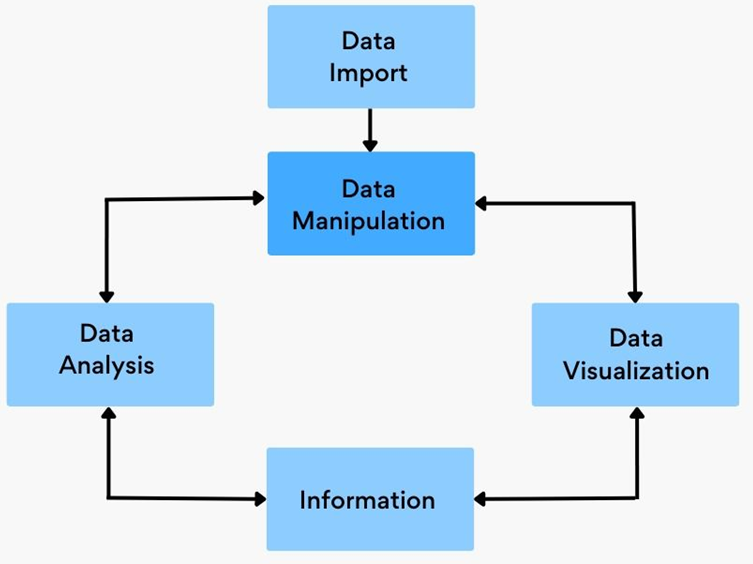
Lesson 1: Data manipluation
In this section, you will learn what types of data and how to maniplate data, including data import and export, as well as reshape data.
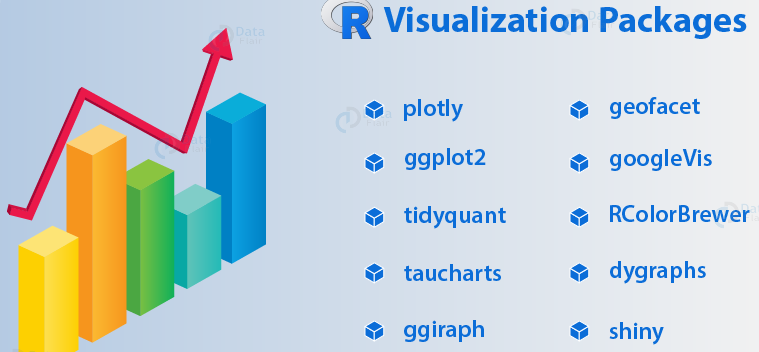
Lesson 2: Data visualization
This section helps you create the most popular visualizations - from quick and dirty plots to publication-ready graphs. The text relies heavily on the ggplot2 package for graphics, but other approaches covered as well.

Lesson 3: Exploratory Analysis
Data exploration is an important step in data science. It mainly includes traditional statistical analysis to interpret data patterns, to find stories and to gain instights.
Lesson 4: Remote sensing images in Ecology
Remote sensing images are great sources for ecological researches. They are especially useful for natural resoures and a variety of socio-economic researches and applications. This section will introduce how to manipluate these data.